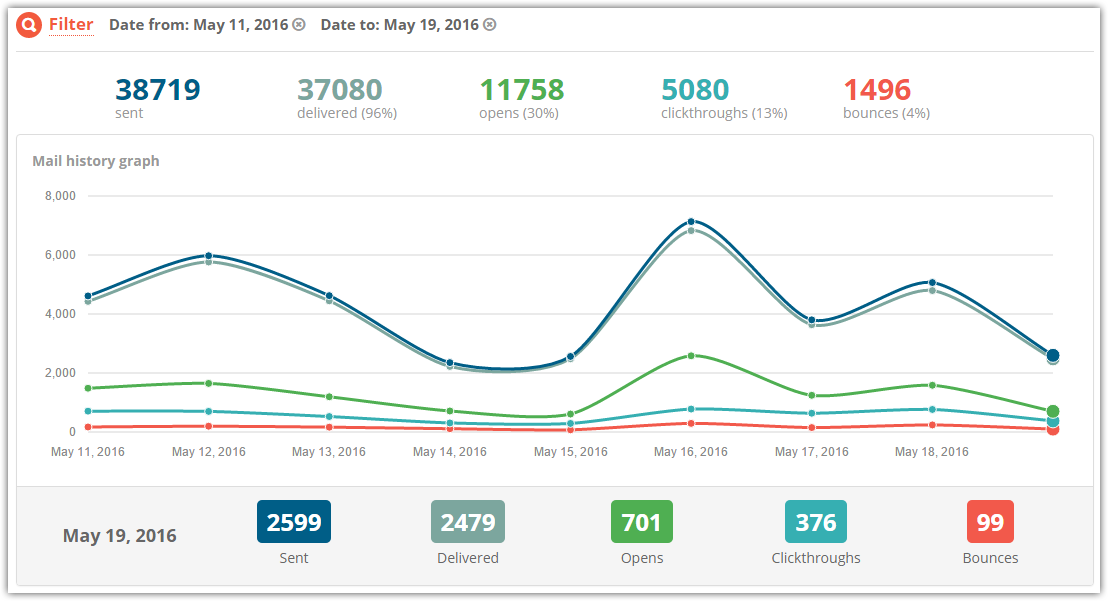
Statistics for sending via SMTP
After your mailing has been sent out, the gathering of statistics begins. The user can view detailed reports for each completed delivery. You can find out how many e-mails were opened, read, how many conversions were made and the number of delivery errors.
Statistics format:
Statistics are shown in the form of two charts:
- statistics for your e-mail campaign (number of mailings sent out, message delivered, conversions, spam reports)

- delivery error chart

If necessary, you can save your campaign results as a local *.csv file.
Using this data can help you optimize your marketing strategy, correct any settings for your e-mail client, and improve the deliverability of your e-mails.
or